Problem
When purchasing commitments, AWS and Azure do not by default properly allocate commitment costs and savings generated across the organization. This creates significant transparency and cost attribution challenges when trying to determine accurate per account/subscription, region, service, or resource type cost and savings.
There are 2 fundamental challenges with the native AWS and Azure billing views:
- Cost is incurred in the account/subscription where the commitment was purchased and not where it was consumed. For customers that centrally purchase commitments (which we strongly recommend as a best practice), the spend for accounts with actual usage will appear low as it is offset by discounts purchased in a separate, central account/subscription where the bulk of the cost accrues.
- The float of matching commitments is random. For example, If an m5.large Reserved Instance is purchased in one AWS account while two m5.large EC2 instances exist in two separate accounts (one m5.large instance in each account), the m5.large instance that actually receives the discount is non-deterministic. The same issue occurs with Azure commitments and how they apply to subscriptions. This variability in discount application creates unpredictability when trying to determine savings on a per resource basis.
For example, typical compute spend on an AWS invoice might look as follows:
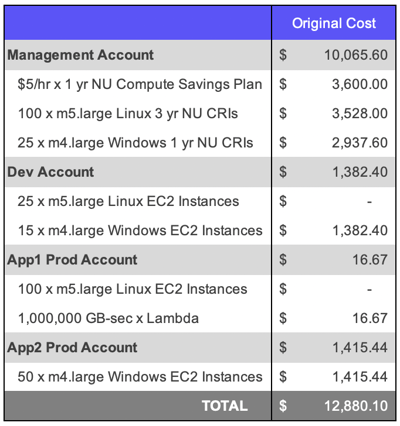
While the total cost of ~$13k is accurate, just about everything else with the default AWS cost and savings allocation is non-sensical from a detailed attribution perspective:
- The Dev account appears to cost $1,382.40 while App1 Prod is only $16.67 and App2 Prod is $1,415.44? Is the App1 Prod cost really so low?
- The m5.large Linux instance line items appear to cost $0 while m4.large Windows spend is $2,797.84? How is that possible?
- The central Management Account with no compute usage is the most expensive account with $10,065.60 of spend. How is it that the cost of all other accounts with actual compute usage is less than the central Management Account with no usage?
- RIs and SPs were in place, but how much savings did they actually generate?
Showback Concept
Showback is the process companies use to take a single, centralized cost and internally allocate it back to departments, products, etc. based on their proportional involvement. Showback is a key component of an effective cloud FinOps strategy, but using native AWS and Azure billing views for showback is problematic and does not work.
Some companies try to solve this issue by decentralizing their commitment management. For example on AWS, they might purchase RIs and SPs in accounts with the corresponding usage then disabling "RI and Savings Plans discount sharing" so the benefits don't float across accounts. Similarly on Azure, organizations might scope Reservations and Savings Plans to specific resource group, management group, or subscription scopes. We cannot recommend more strongly against doing this as it will only REDUCE your savings!!!
The best practice and what our service implements is to:
- Maximize overall savings at the organization level. Our strategies, optimization algorithms, and real-time execution deliver industry-leading Effective Savings Rates. Our platform also implements a number of best practices including centralizing your commitments and running Savings Plans in empty accounts.
- Intelligently reallocate the pool of savings back such that detailed cost and savings attribution is possible at a granular level.
ProsperOps Intelligent Showback
To make it easy for our customers to accurately attribute costs after our service has maximized overall savings, we provide an Intelligent Showback feature for AWS and Azure in the ProsperOps Console.
ProsperOps Intelligent Showback provides granular showback data including:
- Original Cost - Costs for a given service as shown on the invoice (with improperly allocated savings).
- Undiscounted Usage (AWS)/Negotiated Rate Usage (Azure) - What would have been paid to the cloud provider if there were no discounts and the resource was charged at on-demand rates. This serves as a baseline against which savings and costs can be measured.
- Reallocated Savings - The portion of total savings generated within a service properly allocated back.
- Adjusted Cost - AWS service costs with properly allocated savings, i.e., what you've been looking for!! This is calculated by subtracting Reallocated Savings from Undiscounted Usage.
- Net Adjustment - The dollar amount to add to or subtract from the invoice value. You can use this single value against the original cloud provider invoice when adjusting for showback.
Let's look at the example above and enrich it with detailed showback data:
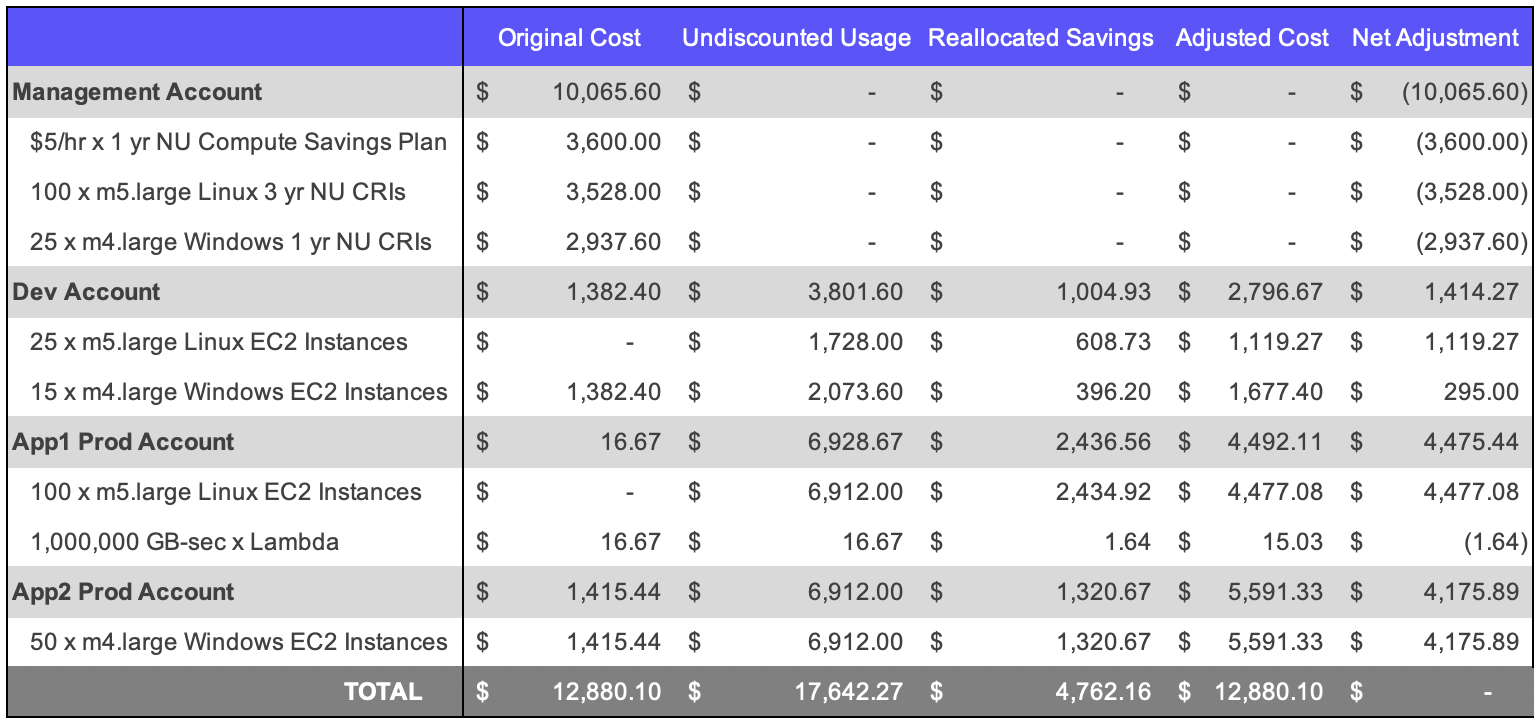
We now see some very interesting and useful things!
- The Adjusted Cost (i.e., with proper showback) for the Dev account is $2,796.67, App1 Prod is $4,492.11, and App2 Prod is $5,591.33. This makes much more sense than the Original Cost where App1 Prod spend was only $16.67.
- The m5.large Linux instance line items cost $5,596.35 while m4.large Windows spend is $7,268.73. This is helpful in understanding EC2 instance type spend versus the Original Cost where m5.large Linux had $0 cost.
- The central Management Account now costs $0 since there is no compute usage, which is as it should be. The cost of the RIs and SPs has been properly allocated out to the resources that received the discount benefit.
- The total Reallocated Savings is $4,762.16, so we now know how much savings were generated! As a bonus, the Effective Savings Rate = Savings / Undiscounted Usage = $4,762.16 / $17,642.27 = 27.0%.
- Lastly, note that total Original Cost and total Adjust Cost are identical. The overall cost and savings haven't changed, they've just been properly "shown back" on a detailed basis.
Additional Feature Notes
- Intelligent Showback is available for all ProsperOps supported AWS services, including Compute, RDS, ElastiCache, OpenSearch, MemoryDB, and Redshift, and Azure Compute (e.g., VMs, App Service, AKS, etc.).
- You can choose to include (default) or exclude the ProsperOps Savings Share depending on whether you want to reallocate net or gross savings, respectively.
- There are two savings reallocation methods available to choose from: Shared Benefit (default) and Earned Benefit. For more details on each, please see this article.
- A CSV download is also available on the Intelligent Showback page. This allows you to pivot the detailed showback data however you want. For example, you might want to understand your Adjusted Costs on a per region basis, or your Linux vs. Windows costs, or your EC2 vs. Fargate vs. Lambda costs, etc.
- A given month's Intelligent Showback data is available once AWS and Azure finalize billing data for that month.